A Smart Tool to Evaluate the Spatial Inclinations of Spiral Galaxies
Web Application
This application is available online at https://edd.ifa.hawaii.edu/inclinet/
Web Application
This application is available online at https://edd.ifa.hawaii.edu/inclinet/
The task of manual evaluation of galaxy inclinations is tedious and time consuming. In the future, with the large astronomical survey telescopes coming online, this task could not be efficiently done manually for thousands of galaxies. The objective of this project is to automatically determine the inclination of spiral galaxies with the human level accuracy providing their images, ideally in both colorful and black-and-white formats.
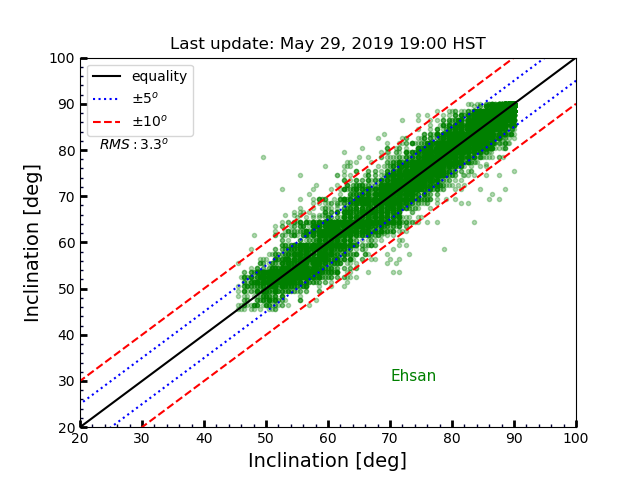
Our collection of carefully measured inclinations provides a rich data set for training a machine-learning algorithm, such as the Convolutional Neural Network (CNN), to replace the human eye in future projects. To successfully instruct such a network to produce satisfactory results, a training set of order ~10,000 representative galaxies is required. Our entire sample is of such a size, and hence suitable for exploring machine-learning capabilities. Moreover, n-body cosmological simulations such as Illustris provide exquisite images of projected spiral galaxies with known 3D orientations that could be of potential interest as training sets for inclination studies.
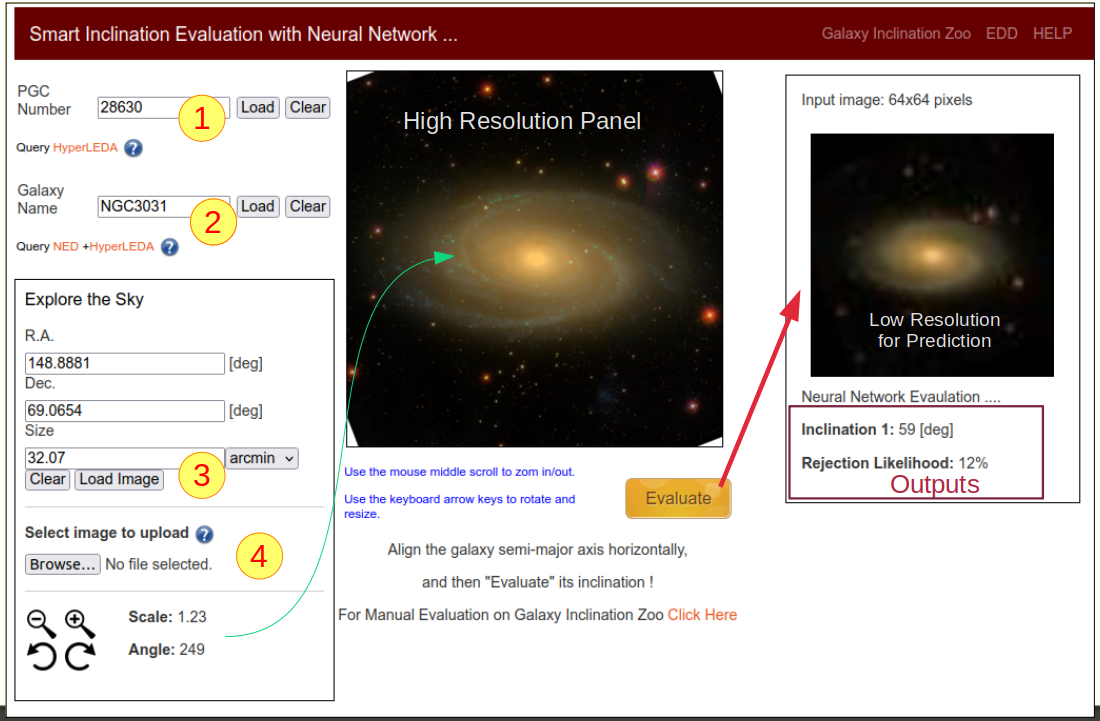
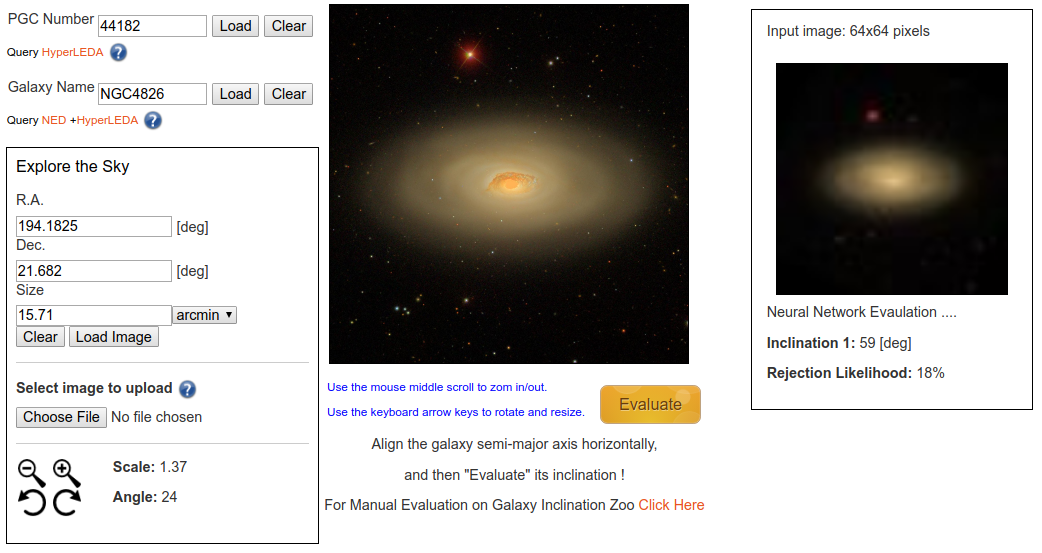
On the left side of this Web GUI, users have different options to find and load a galaxy image. The PGC-based query relies on the information provided by the HyperLEDA catalog. Each image is rotated and resized based on the LEDA entries for “logd25” and position angle (pa), which are reasonable in most cases. Further manual alignment features are provided, however the evaluation process is independent of the orientation of the image. Clicking on the Evaluate button, the output inclinations generated by various ML models are generated and the average results are displayed on the right side. This step feeds the image to a pre-trained neural network(s) and outputs the averages of the determined inclination value. In addition, there are other networks that separately predict the rejection probability of the galaxy by human users. For practical reasons, all images are converted to square sizes and re-scaled to 128x128 pixels prior to the evaluation process.
This online GUI allows users to submit a galaxy image through four different methods, as described in the list below. The numbers in the list correspond to the yellow labels in the above Figure.
1. Galaxy PGC ID
Entering the name of a galaxy by querying its PGC number (the ID of galaxy in the Principal Galaxy Catalog) - The PGC catalog is deployed with our model, and contains a table of galaxy coordinates and their sizes. Images are then queried from the SDSS quick-look image server.
2. Galaxy Name
Searching a galaxy by its common name. - The entered name is queried through the NASA/IPAC Extragalactic Database. Then, a python routine based on the package Beautiful Soup extracts the corresponding PGC number. Once the PGC ID is available, the galaxy image is imported from the SDSS quick-look.
3. Galaxy Coordinates
A specific location in the sky can be queried by entering the sky coordinates and the field size. In the first release we only provide access to the SDSS images, if they are available. The SDSS coverage is mainly limited to the Northern sky.
4. Galaxy Image
Uploading a galaxy image from the local computer of the user. User has the option of uploading a galaxy image for evaluation(s) by our model(s).
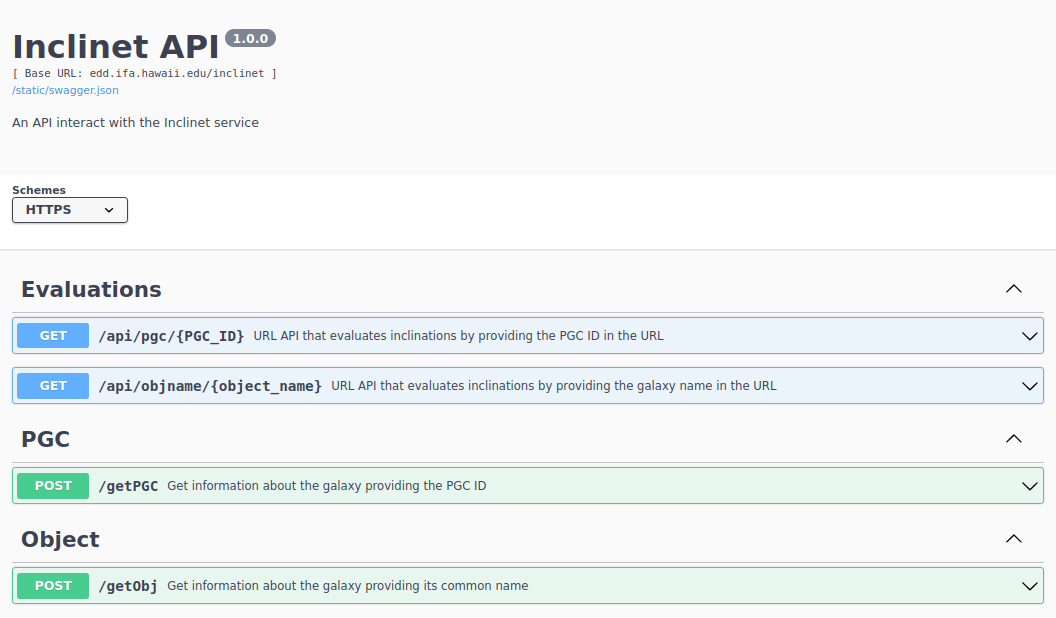
API
This application is available in the form of an API that outputs the evaluated inclinations through a REST API.
The complete documentation of the API of this applications is available here:
https://edd.ifa.hawaii.edu/static/html/tutorial.html#API
Our collection of carefully measured inclinations provides a rich data set for training a machine-learning algorithm, such as the Convolutional Neural Network (CNN), to replace the human eye in future projects. To successfully instruct such a network to produce satisfactory results, a training set of order ~10,000 representative galaxies is required. Our entire sample is of such a size, and hence suitable for exploring machine-learning capabilities. Moreover, n-body cosmological simulations such as Illustris provide exquisite images of projected spiral galaxies with known 3D orientations that could be of potential interest as training sets for inclination studies.
On the left side of this Web GUI, users have different options to find and load a galaxy image. The PGC-based query relies on the information provided by the HyperLEDA catalog. Each image is rotated and resized based on the LEDA entries for “logd25” and position angle (pa), which are reasonable in most cases. Further manual alignment features are provided, however the evaluation process is independent of the orientation of the image. Clicking on the Evaluate button, the output inclinations generated by various ML models are generated and the average results are displayed on the right side. This step feeds the image to a pre-trained neural network(s) and outputs the averages of the determined inclination value. In addition, there are other networks that separately predict the rejection probability of the galaxy by human users. For practical reasons, all images are converted to square sizes and re-scaled to 128x128 pixels prior to the evaluation process.
This online GUI allows users to submit a galaxy image through four different methods, as described in the list below. The numbers in the list correspond to the yellow labels in the above Figure.
1. Galaxy PGC ID
Entering the name of a galaxy by querying its PGC number (the ID of galaxy in the Principal Galaxy Catalog) - The PGC catalog is deployed with our model, and contains a table of galaxy coordinates and their sizes. Images are then queried from the SDSS quick-look image server.
2. Galaxy Name
Searching a galaxy by its common name. - The entered name is queried through the NASA/IPAC Extragalactic Database. Then, a python routine based on the package Beautiful Soup extracts the corresponding PGC number. Once the PGC ID is available, the galaxy image is imported from the SDSS quick-look.
3. Galaxy Coordinates
A specific location in the sky can be queried by entering the sky coordinates and the field size. In the first release we only provide access to the SDSS images, if they are available. The SDSS coverage is mainly limited to the Northern sky.
4. Galaxy Image
Uploading a galaxy image from the local computer of the user. User has the option of uploading a galaxy image for evaluation(s) by our model(s).
API
This application is available in the form of an API that outputs the evaluated inclinations through a REST API.
The complete documentation of the API of this applications is available here:
https://edd.ifa.hawaii.edu/static/html/tutorial.html#API
Documentation
The full documentation of this application is available at https://edd.ifa.hawaii.edu/static/html/index.html
Acknowledgments
About the data
All data exposed by the IncliNET project belongs to
Citation:
Please cite the following paper and the gitHub repository of this project.
Cosmicflows-4: The Catalog of ∼10,000 Tully-Fisher Distances (2020, ApJ, 902, 145)
Disclaimer
All rights reserved. The material may not be used, reproduced or distributed, in whole or in part, without the prior agreement.
The full documentation of this application is available at https://edd.ifa.hawaii.edu/static/html/index.html
Acknowledgments
About the data
All data exposed by the IncliNET project belongs to
- Cosmicflows-4 program
- Copyright (C) Cosmicflows
- Team - The Extragalactic Distance Database (EDD)
Citation:
Please cite the following paper and the gitHub repository of this project.
Cosmicflows-4: The Catalog of ∼10,000 Tully-Fisher Distances (2020, ApJ, 902, 145)
Disclaimer
All rights reserved. The material may not be used, reproduced or distributed, in whole or in part, without the prior agreement.


 RSS Feed