Published Papers by our team
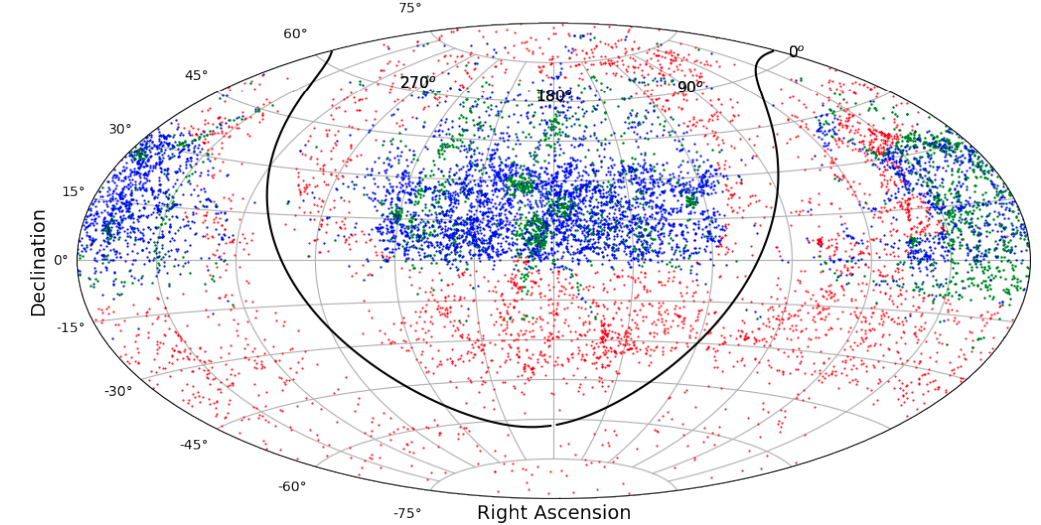
An Aitoff equatorial projection of spiral galaxies in this study. Red points are spirals with only WISE photometry (3234 galaxies). Blue points represent spirals that only have photometry information from the SDSS imaging (5258 galaxies) and green points have photometry coverage from both SDSS and WISE (2244 galaxies). Black solid curve is the projection of the Milky Way plane.
Publications:
Cosmicflows 4: The Catalog of ~10000 Tully-Fisher Distances
Ehsan Kourkchi, R Brent Tully, Sarah Eftekharzadeh, Jordan Llop, Helene M Courtois, Daniel Guinet, Alexandra Dupuy, James D Neill, Mark Seibert, Michael Andrews, Juana Chuang, Arash Danesh, Randy Gonzalez, Alexandria Holthaus, Amber Mokelke, Devin Schoen, Chase Urasaki Cosmicflows 4: The Calibration of Optical and Infrared Tully-Fisher Relations Kourkchi, E.; Tully, R. Brent, Anand, Gagandeep S., Courtois, Helene, Dupuy, Alexandra, Neil, J. Don, Rizzi, Luca, Seibert, Mark. Global Attenuation in Spiral Galaxies in Optical and Infrared Bands Kourkchi, E.; Tully, R. B.; Neill, J. D.; Seibert, M.; Courtois, H. M.; Dupuy, A. 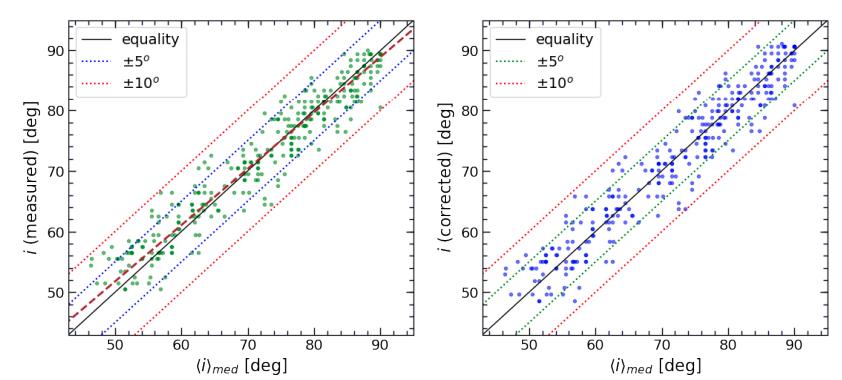
Evaluated inclinations by an user versus the median of all measurements given by all users, <i>_med. Each point represents a galaxy. Black line shows the locus of equality of the values. Blue and red dotted lines illustrate deviations from equality by ±5 ◦ and ±10◦ , respectively. Left: Green points are the unadjusted inclinations reported by the user. Maroon dashed line fits the green points found by minimizing the mean squared of the residuals along the vertical axis. Right Corrected inclinations using the linear fit presented in the left panel.
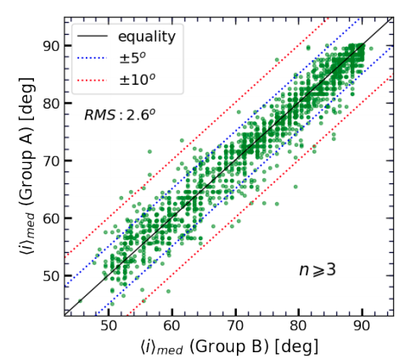
The median of the evaluated inclinations by two different groups of users for ∼1800 galaxies. Each point represent a galaxy with at least three independent measurements by each group. The RMS of deviations from equality is 2.6 ◦ .
|
|
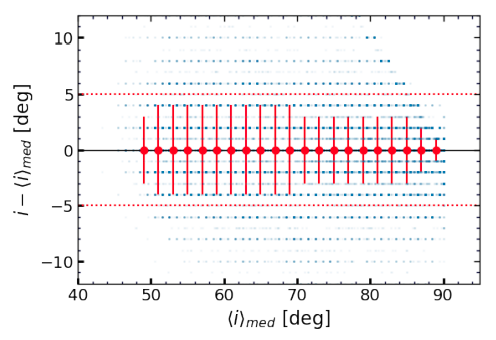
Differences between individual evaluated inclinations, i, and the median of all measurements, <i>_med. Each blue point represents a single estimated inclination for a galaxy. Red dotted horizontal lines are drawn at the level of ±5 ◦ deviations. Red filled circles and their error bars illustrate the median and 1σ standard deviations of the blue points within the 1◦ bins.
|
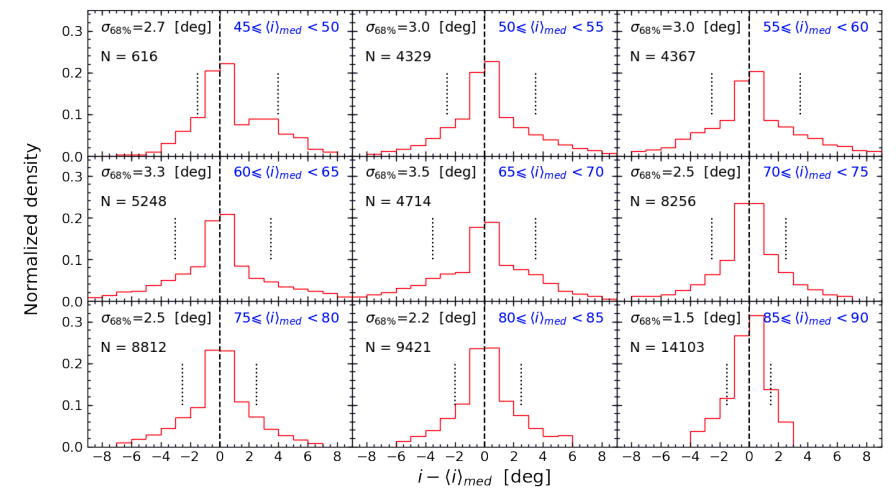
Distribution of the deviations of individual evaluations of inclinations, i, from the median value of all measurements, <i>_med. Each panel covers a 5◦ interval of inclination. N is the number of individual measurements used in each panel. Vertical dotted lines identify the exclusion of 34% of data points on opposite sides of the histograms.
|
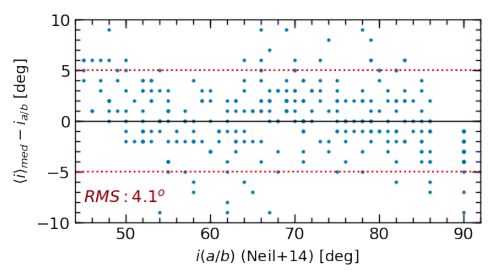
Difference of the median measured inclinations in this study, <i>_med, and those derived based on axial rations, i_a/b. Red dotted lines identify the ±5 ◦ region. The root mean squared of deviations equals 4.1 ◦ .
|