Galaxy Inclination Zoo
  • Blog
  • Publications
  • InciNET
  • Home (Inclination Zoo)
  • About

IncliNET

10/3/2021

0 Comments

 
A Smart Tool to Evaluate the Spatial Inclinations of Spiral Galaxies

Web Application

This application is available online at https://edd.ifa.hawaii.edu/inclinet/


Picture
The task of manual evaluation of galaxy inclinations is tedious and time consuming. In the future, with the large astronomical survey telescopes coming online, this task could not be efficiently done manually for thousands of galaxies. The objective of this project is to automatically determine the inclination of spiral galaxies with the human level accuracy providing their images, ideally in both colorful and black-and-white formats.

Our collection of carefully measured inclinations provides a rich data set for training a machine-learning algorithm, such as the Convolutional Neural Network (CNN), to replace the human eye in future projects. To successfully instruct such a network to produce satisfactory results, a training set of order ~10,000 representative galaxies is required. Our entire sample is of such a size, and hence suitable for exploring machine-learning capabilities. Moreover, n-body cosmological simulations such as Illustris provide exquisite images of projected spiral galaxies with known 3D orientations that could be of potential interest as training sets for inclination studies.

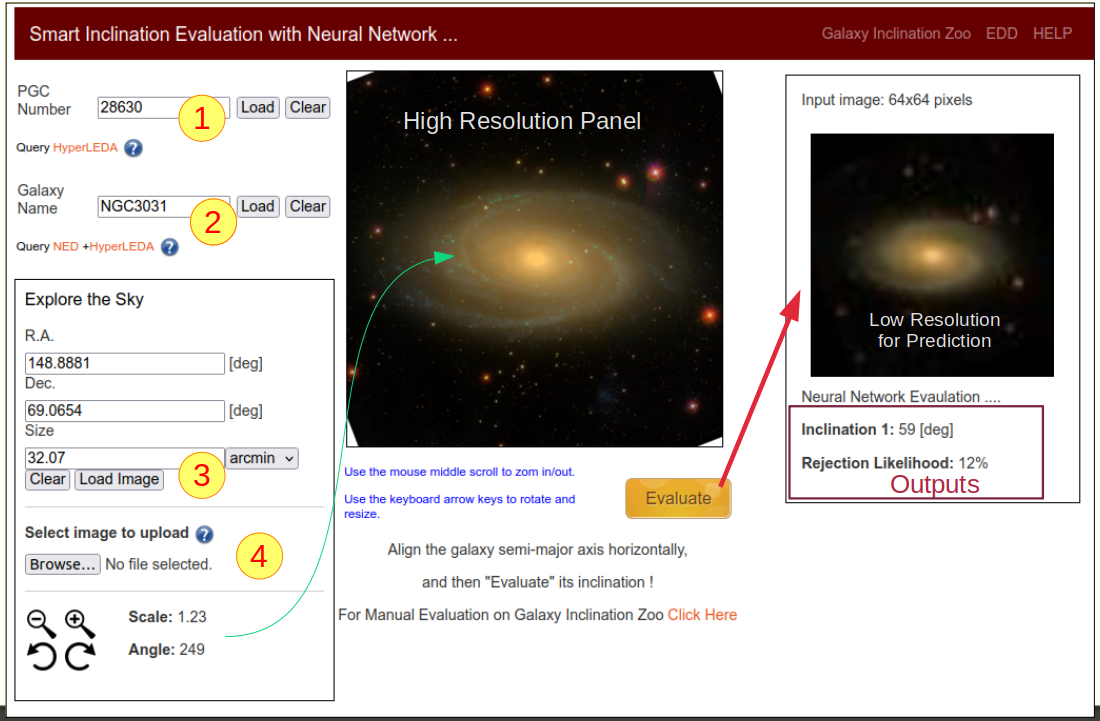
On the left side of this Web GUI, users have different options to find and load a galaxy image. The PGC-based query relies on the information provided by the HyperLEDA catalog. Each image is rotated and resized based on the LEDA entries for “logd25” and position angle (pa), which are reasonable in most cases. Further manual alignment features are provided, however the evaluation process is independent of the orientation of the image. Clicking on the Evaluate button, the output inclinations generated by various ML models are generated and the average results are displayed on the right side. This step feeds the image to a pre-trained neural network(s) and outputs the averages of the determined inclination value. In addition, there are other networks that separately predict the rejection probability of the galaxy by human users. For practical reasons, all images are converted to square sizes and re-scaled to 128x128 pixels prior to the evaluation process.

This online GUI allows users to submit a galaxy image through four different methods, as described in the list below. The numbers in the list correspond to the yellow labels in the above Figure.


1. Galaxy PGC ID

Entering the name of a galaxy by querying its PGC number (the ID of galaxy in the Principal Galaxy Catalog) - The PGC catalog is deployed with our model, and contains a table of galaxy coordinates and their sizes. Images are then queried from the SDSS quick-look image server.

2. Galaxy Name

Searching a galaxy by its common name. - The entered name is queried through the NASA/IPAC Extragalactic Database. Then, a python routine based on the package Beautiful Soup extracts the corresponding PGC number. Once the PGC ID is available, the galaxy image is imported from the SDSS quick-look.

3. Galaxy Coordinates

A specific location in the sky can be queried by entering the sky coordinates and the field size. In the first release we only provide access to the SDSS images, if they are available. The SDSS coverage is mainly limited to the Northern sky.

4. Galaxy Image

Uploading a galaxy image from the local computer of the user. User has the option of uploading a galaxy image for evaluation(s) by our model(s).


API

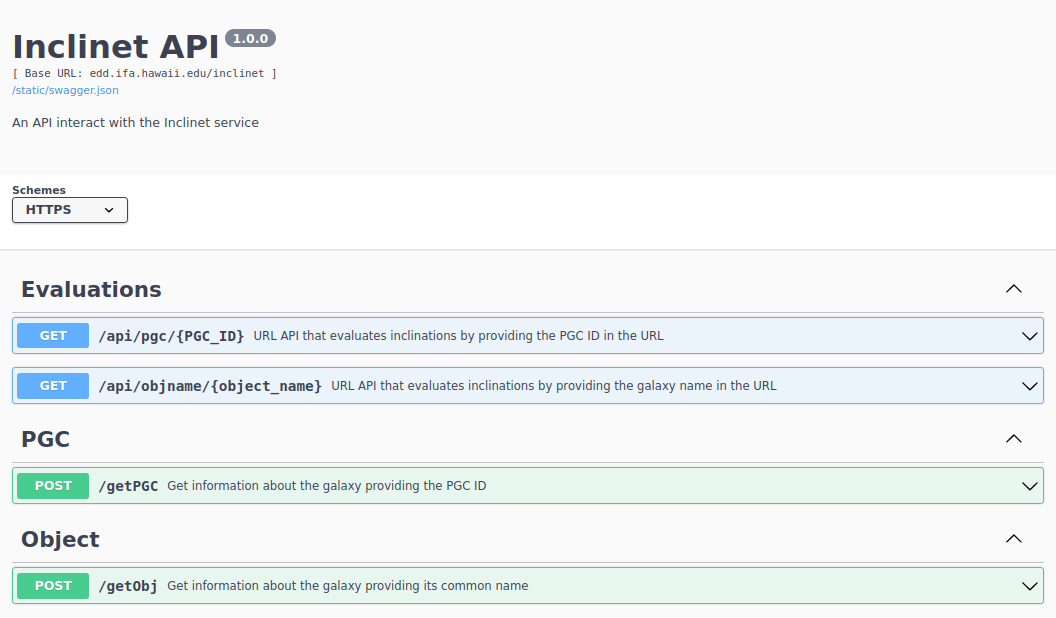
This application is available in the form of an API that outputs the evaluated inclinations through a REST API.
The complete documentation of the API of this applications is available here:
https://edd.ifa.hawaii.edu/static/html/tutorial.html#API

Picture
Documentation
The full documentation of this application is available at https://edd.ifa.hawaii.edu/static/html/index.html

Acknowledgments

About the data

All data exposed by the
IncliNET project belongs to
  • Cosmicflows-4 program
  • Copyright (C) Cosmicflows
  • Team - The Extragalactic Distance Database (EDD)

Citation:

Please cite the following paper and
the gitHub repository of this project.
Cosmicflows-4: The Catalog of ∼10,000 Tully-Fisher Distances (2020, ApJ, 902, 145)


Disclaimer

All rights reserved. The material may not be used, reproduced or distributed, in whole or in part, without the prior agreement.
0 Comments

Ask a question ....

9/30/2021

19 Comments


A complete manual is available here.
You can also find older questions and their answers here. Leave a comment below if you have any new question.

Picture
19 Comments

New publication on Cosmicflows-4 ...

9/9/2020

0 Comments

 
Picture
2020, ApJ, 902, 145
Cosmicflows 4: The Catalog of ~10000 Tully-Fisher Distances
Ehsan Kourkchi, R Brent Tully, Sarah Eftekharzadeh, Jordan Llop, Helene M Courtois, Daniel Guinet, Alexandra Dupuy, James D Neill, Mark Seibert, Michael Andrews, Juana Chuang, Arash Danesh, Randy Gonzalez, Alexandria Holthaus, Amber Mokelke, Devin Schoen, Chase Urasaki

We present the distances of 9792 spiral galaxies lying within 15,000 km/s using the relation between luminosity and rotation rate of spiral galaxies. The sample is dominantly, but not exclusively, drawn from galaxies detected in the course of the ALFALFA HI survey with the Arecibo Telescope. Relations between HI line widths and luminosity are calibrated at SDSS u, g, r, i, z bands, and WISE W1 and W2 bands. By exploiting secondary parameters, particularly color indices, we address discrepancies between measured distances at different wavebands with unprecedented detail. We provide a catalog that includes reduced kinematic, photometric, and inclination parameters. A machine learning algorithm is described based on the random forest technique that predicts the dust attenuation in spirals lacking infrared photometry. A value of the Hubble Constant is determined of H0 = 75.1+-0.2 (stat.), with potential systematics up to +-3 km/s/Mpc.
Acknowledgments ...
We are pleased to acknowledge the citizen participation to scientific research of undergraduate students at University of Hawaii, members of amateurs astronomy clubs in France Planétarium de Vaulx-en-Velin, Association Clair d’étoiles et Brin d’jardin, Société astronomique de Lyon, Club d’astronomie Lyon Ampère, Club d’astronomie des monts du lyonnais, Club d’astronomie de Dijon, and friends who helped us with measuring inclinations of spiral galaxies in our sample.


0 Comments

Smart Evaluation of Spirals Inclinations Using Convolutional Neural Network

2/27/2020

1 Comment

 
​An application to automatically find the the spatial inclination of Spiral Galaxies using Convolutional Neural Network. The model has been implemented in TensorFlow and uses the outputs of the Galaxy Inclination Zoo for ~10,000 spirals. 
Picture
For this demo version, the JPG colorful images are taken from the SDSS skyserver. In terms of image quality, SDSS images are nice and homogeneous across the sample. The aligned version of images are used, because finding the semi-major axis of spirals and hence their position angles are fairly easy tasks for other tools.

1,500 randomly chosen images are set aside (we didn't use them in the training process) to check the reliability of the resulting network. In the end, we could generate a model that outputs inclinations with an RMS of 3 degrees.

This model is now available to test on any arbitrary spiral galaxy with the SDSS coverage. Please follow this link and open the online application: http://edd.ifa.hawaii.edu/incNET/
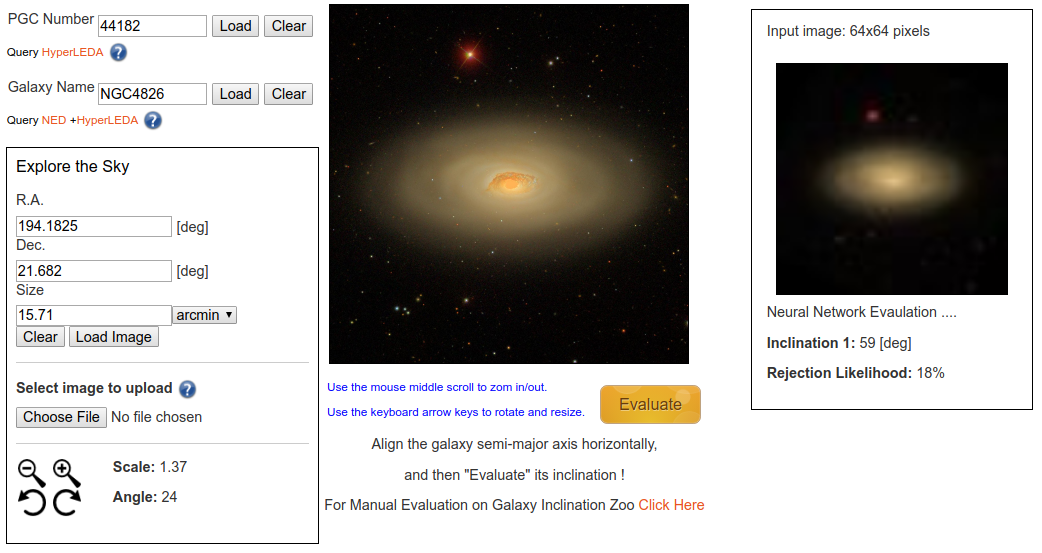
  • On the left side of this tool, the user has different options to find and load the galaxy image. The PGC-based query relies on the information provided by the LEDA catalog available on the EDD. Each image is rotated and resized based on the LEDA entries for "logd25" and "pa", which are reasonable for most of the cases. 
  • After manually aligning the semi-major axis of the galaxy along the horizontal axis, the user clicks on the orange button to "Evaluate" the galaxy inclination. This step feeds the image to the pre-trained neural network and outputs the inclination value. In addition, there is another network that predicts the rejection probability of such an image by human users.
  • This demonstrations shows that in the future, less human labor is needed to sort galaxies. There are smart ways to find out outliers by using the results of two neural networks with slightly different architecture and/or initialization. For a given galaxy, if the two neural networks do not agree to some threshold, that galaxy needs extra human attention.
1 Comment

FirstĀ paperĀ is published using the Galaxy Inclination Zoo data

9/12/2019

0 Comments

 
We are glad to announce that the first paper of a series of papers to generate the Cosmicflows-4 distance catalog is accepted for publication in the Astrophysical Journal (2019, ApJ, 884, 82).

This paper would not have been possible without the output results of the Galaxy 
Inclination Zoo collaborative tool.

The pdf version of this paper is available here: https://arxiv.org/pdf/1909.01572.pdf

We are pleased to acknowledge the citizen participation to scientific research of undergraduate students at University of Hawaii, members of amateurs astronomy clubs in France Planétarium de Vaulx-en-Velin, Association Clair d’étoiles et Brin d’jardin, Société astronomique de Lyon, Club d’astronomie Lyon Ampère, Club d’astronomie des monts du lyonnais, Club d’astronomie de Dijon, and friends who helped us with measuring inclinations of spiral galaxies in our sample.

The project is still going on and we hope to get more exciting scientific results soon.

Picture
0 Comments

An overview on the status of the project

12/4/2018

0 Comments

 
 In this presentation, I am talking a little bit about the current status of the project.

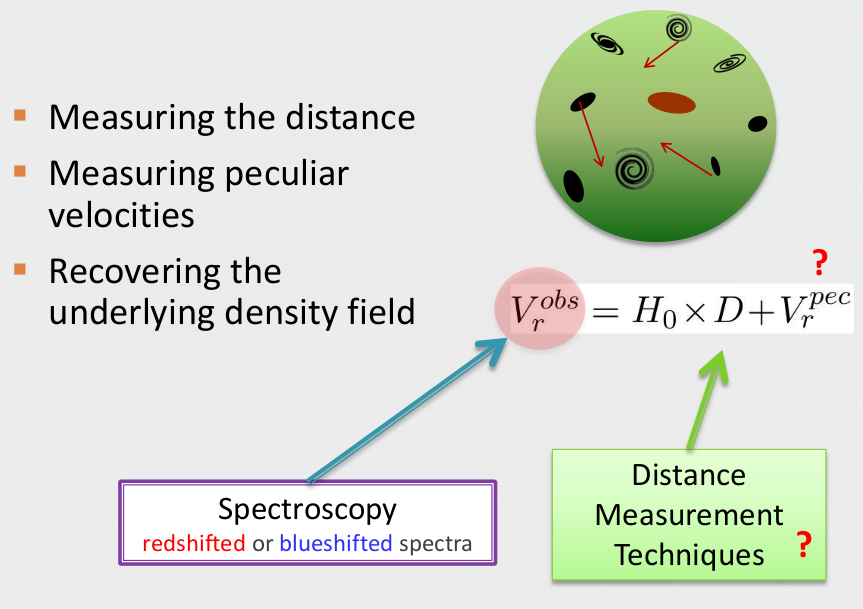
The main goal of our research is to map out the density structure of matter in the local universe. To do so, we need to measure the relative velocity of galaxies, known as peculiar velocities. However, as we observe galaxies from the  Earth, the measured radial velocity of a galaxy is a superposition of the global Hubble expansion rate and the peculiar velocities. 

This means that to extract galaxies peculiar velocities, we need to measure their physical distances, and then subtract the resulting Hubble expansion rate from the measured radial velocities. Using the resulting peculiar velocities, later we can recover the underlying density field and discover structures like our home supercluster known as Laniakea.

Picture
Picture
But the question is that how we measure the distances of galaxies. There are many different methods to measure distances, and each one only works with specific objects. In this research we focus on only Spiral galaxies. There is a well-known relationship between the absolute luminosity of spiral galaxies and how fast they rotate. In Astronomy. this famous relationship is known as Tully-Fisher relationship. Intuitively, one expects that more massive galaxies to be brighter and rotate faster. If we measure how fast a galaxy rotates, then we can estimate its absolute luminosity and compare it with its apparent luminosity that we observe. The difference between absolute and apparent luminosity gives us to the actual distances of galaxies. 

With all of that in mind, to achieve our goal we need to measure two different quantities. First, we need to measure the rotation velocity of galaxies, which results in their absolute luminosity if we use the Tully-Fisher relationship that connects rotation rate and luminosity. Second, we need to measure the apparent magnitude of galaxies, which together with the obtained absolute luminosity from the previous step, it gives us distances to galaxies.

Spiral galaxies are late-type galaxies with a lot of atomic Hydrogen gas which undergoes star formation. The hydrogen atom consists of one proton and one electron. Each hydrogen atom can be found in two different states. In one state, both electron and proton have the same spin directions, and in the other state, electron and proton have opposite spin directions. The opposite spin direction has slightly lower energy level and the transition from high to low energy states produces radio emission that can be observed at 21 cm.
Picture
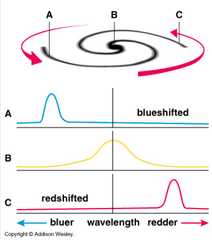
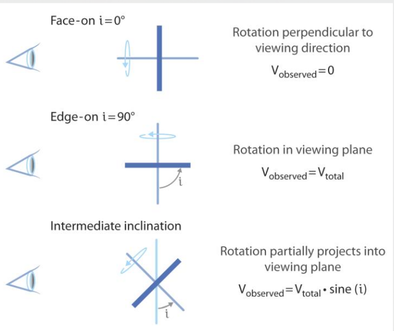
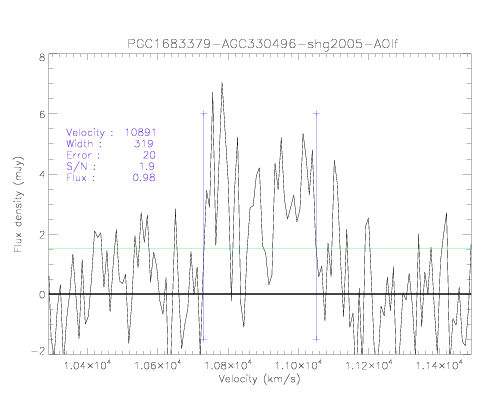
Some of this 21 cm emission is blue shifted and some redshifted as the consequence of the rotation of spiral galaxy. This means that the 21 cm emission line is broadened due to rotation. Faster a galaxy rotates, the broader the 21 cm line is. In addition to the rotation, the inclination of the galaxy can change the broadening of the 21 cm emission line. If a galaxy is totally face-on, the observer does not see any rotation and the broadening factor in minimal. As the inclination increases, the 21 cm line-width increases. This means that in addition to the radio observations we need to measure the inclination of galaxies.
Picture
The current study mainly focuses on the Northern part of the sky where we had both radio and optical data. This study complements the previous Cosmicflows3 catalog. The absolute luminosity or the mass of spiral galaxies is related to their total rotation velocity. However, what we really get from the HI 21 cm line-widths is the observed rotations that has the projection factor dictated by the galaxy inclination. Therefore, it is important to measure the inclination of galaxies with high accuracy. If a galaxy is face-on, its inclination is 0 and all edge-on galaxies have the inclination of 90 degrees. 

So far, all users together have spent more than 1,100 hours on this project. About 5,000 galaxies have been already rejected due to the poor quality of images or bad HI profiles which made them bad candidates for the distance measurements using TF relationship. For those galaxies that have not been rejected, we have made sure that there are at least 3 different measurements done by different users. This increases the accuracy of the final results as we use the median of all measurements. If a user makes a terrible mistake and introduces an outlier which is not consistent with other measurements, that measurement would be later removed. 

At this time, we have enough information and data to move on to the next level of analysis and prepare the next generation of distance catalog using which we can find more local galaxy structures, like Laniakea. I would like to thank all of those who have already participated or will participate in this project. With more measurements, we can better understand the nature of uncertainties and minimize them, which leads us to better and more accurate distance measurements required for Cosmicflows calculations. All the final products and data catalogs would be available to public through the Extra-Galactic Distance Data-Base. I appreciate all of your comments and suggestions that help us with improving this process.

Up
0 Comments

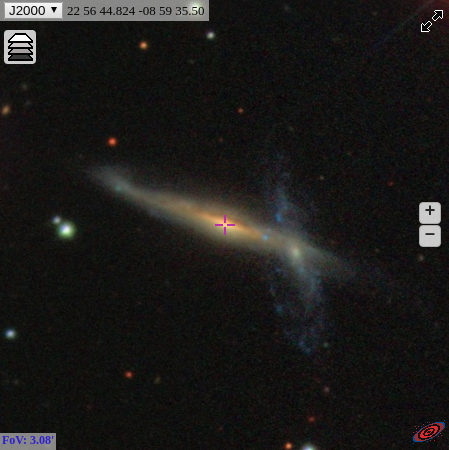
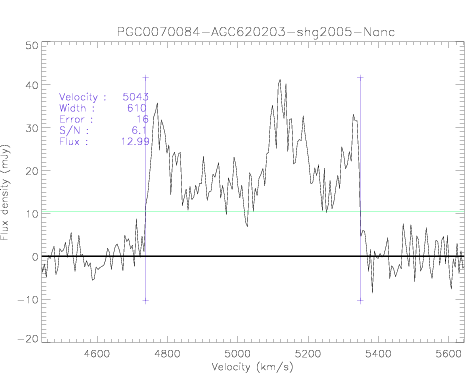
Meregers

6/15/2018

0 Comments

 
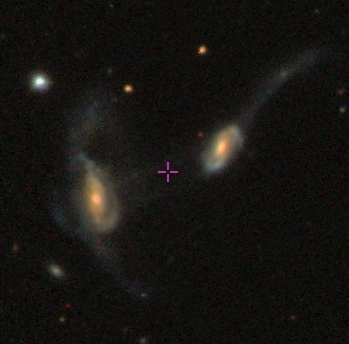
PGC51853
Picture

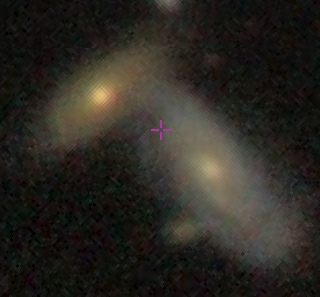
PGC1683379
Picture
Picture

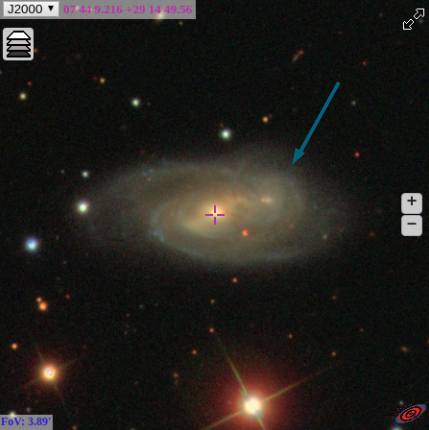
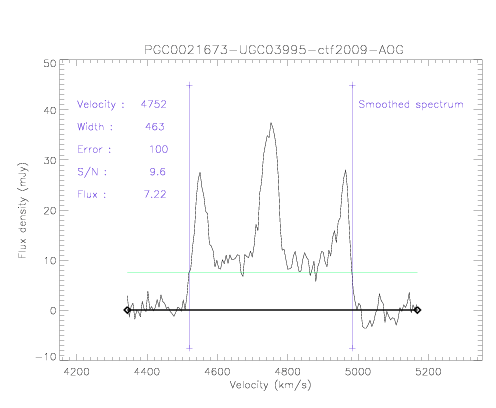
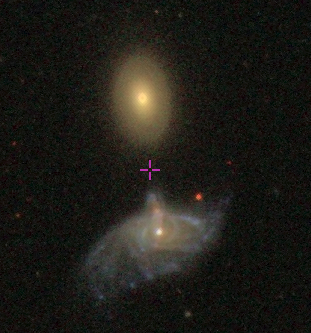
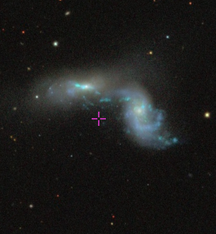
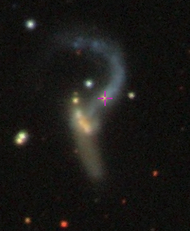
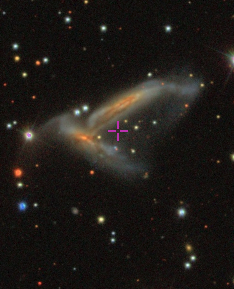
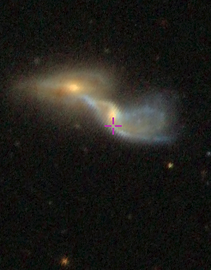
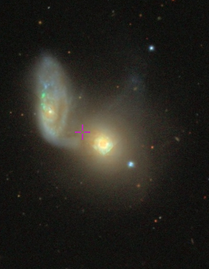
We reject all mergers and interacting galaxies with disturbed structures. The following galaxy (pgc21673) is an interesting case where another face-on galaxy is overlapping the original galaxy. 


PGC21673
Picture
Picture

PGC70084
Picture
Picture

Picture
PGC4750
Picture
PGC32424
Picture
PGC58267

Picture
PGC68573
Picture
PGC44188
Picture
PGC55482
0 Comments

Users Geo-locations

6/15/2018

0 Comments


Red points represent the geographical distribution of all users who are participating in this project.

0 Comments

Scatter Plots

6/11/2018

0 Comments


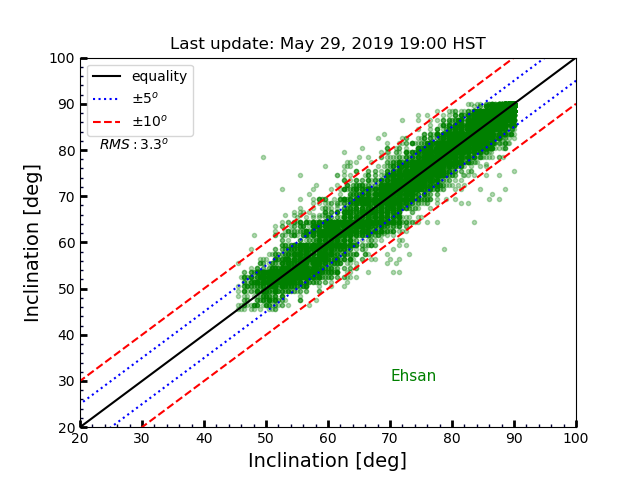
This plot compares my measurements against the median measurements done by the other users.
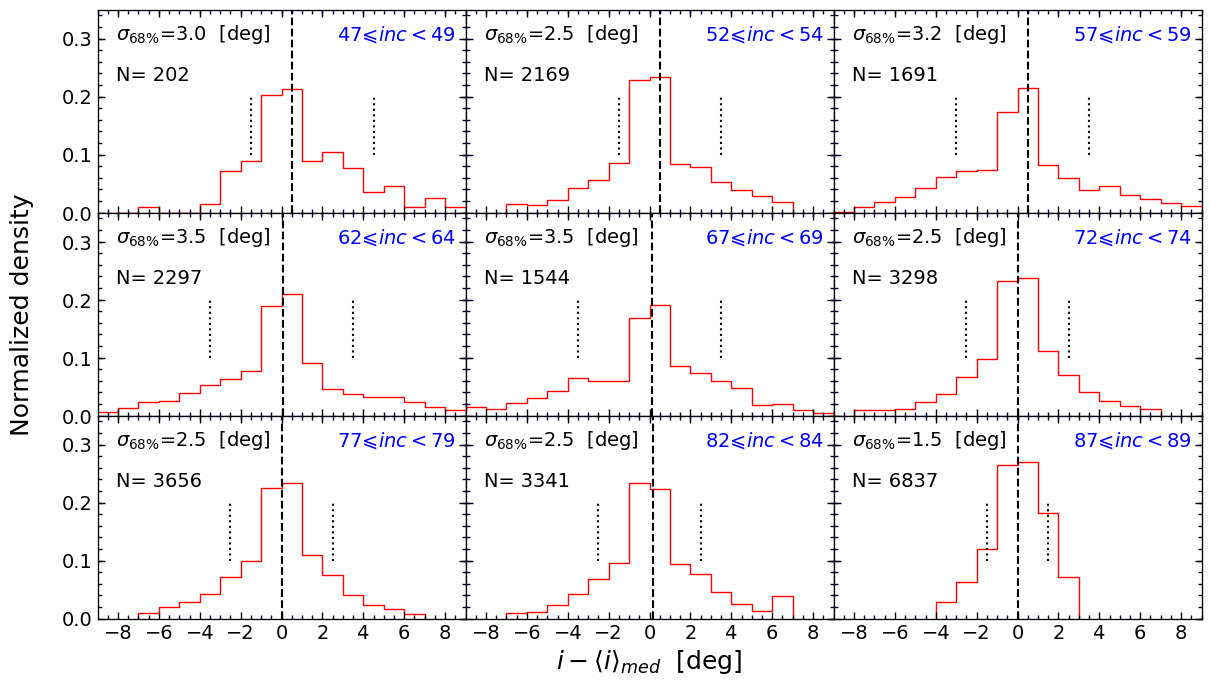
NOTE: In general, +/-5 degrees scatter is OK. You need to be more careful to increase your accuracy and reduce the scatter. In particular, you need to be more careful when it comes to low inclined (more face-on) galaxies. We know that the uncertainty is larger for more face-on galaxies. In order to decrease the uncertainty, just make a 3-dimensional mental picture of galaxies in your head and try to make sense of their inclinations. Just imagine how you can rotate a round flat disk in space to create the 2D projected image you see.

0 Comments

Progression Plots ...

6/10/2018

0 Comments

 
Left top panel shows the statistics of the sorted galaxies.The blue bar represents the total number of candidates in our catalog. The red column shows how many galaxies have at least one measurement. The yellow and green bars display the number of galaxies with at least 2 and 3 measurements, respectively.

Left bottom panel shows the number of sorted galaxies as a function of time (this includes all visits: practice, training, calibration, etc).

0 Comments
<<Previous

    Cosmicflow Project

    An ambitious project to map out our local universe ...

    Archives

    October 2021
    September 2021
    September 2020
    February 2020
    September 2019
    December 2018
    June 2018

    Categories

    All
    Questions

    RSS Feed

    Picture
    Picture
    Picture
    Picture
Powered by Create your own unique website with customizable templates.